Page 12 - of Khadrun’, and that Mark said about the lineage of Jesus son of ‎Mary that he was 'The word of God which He placed in the human ‎body, so it became human’, and that Luke said, 'Jesus son of Mary ‎and his mother were humans of flesh and blood, so the Ho
P. 12

Investor Guide to Iraq 2021

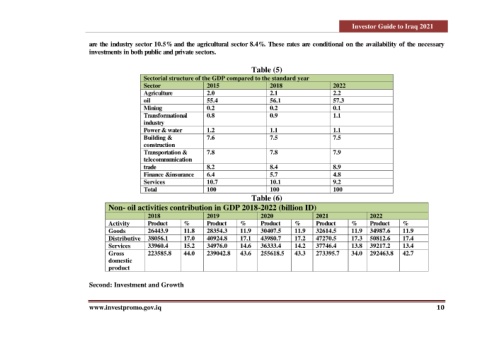
                                are the industry sector 10.5% and the agricultural sector 8.4%. These rates are conditional on the availability of the necessary
                                investments in both public and private sectors.

                                                                                         Table (5)
                                                   Sectorial structure of the GDP compared to the standard year
                                                   Sector                 2015                  2018                  2022
                                                   Agriculture            2.0                   2.1                   2.2
                                                   oil                    55.4                  56.1                  57.3
                                                   Mining                 0.2                   0.2                   0.1
                                                   Transformational       0.8                   0.9                   1.1
                                                   industry
                                                   Power & water          1.2                   1.1                   1.1
                                                   Building &             7.6                   7.5                   7.5
                                                   construction
                                                   Transportation &       7.8                   7.8                   7.9
                                                   telecommunication
                                                   trade                  8.2                   8.4                   8.9
                                                   Finance &insurance     6.4                   5.7                   4.8
                                                   Services               10.7                  10.1                  9.2
                                                   Total                  100                   100                   100
                                                                                         Table (6)

                                       Non- oil activities contribution in GDP 2018-2022 (billion ID)
                                                     2018                 2019              2020                2021               2022
                                       Activity      Product     %        Product    %      Product     %       Product     %      Product    %
                                       Goods         26443.9     11.8     28354.3    11.9   30407.5     11.9    32614.5     11.9  34987.6     11.9
                                       Distributive   38056.1    17.0     40924.8    17.1   43980.7     17.2    47270.5     17.3  50812.6     17.4
                                       Services      33960.4     15.2     34976.0    14.6   36333.4     14.2    37746.4     13.8  39217.2     13.4
                                       Gross         223585.8    44.0     239042.8   43.6   255618.5    43.3    273395.7    34.0  292463.8    42.7
                                       domestic
                                       product

                                Second: Investment and Growth


                                www.investpromo.gov.iq                                                                                                     10
   7   8   9   10   11   12   13   14   15   16   17