
Page 19 - investment-map-En-2021
P. 19
13
Iraq Investment Map2020-2021
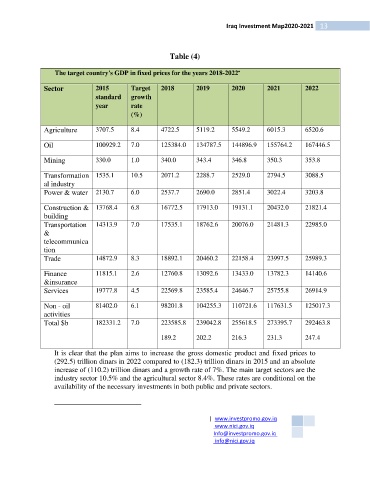
Table (4)
The target country's GDP in fixed prices for the years 2018-2022
Sector 2015 Target 2018 2019 2020 2021 2022
standard growth
year rate
(%)
Agriculture 3707.5 8.4 4722.5 5119.2 5549.2 6015.3 6520.6
Oil 100929.2 7.0 125384.0 134787.5 144896.9 155764.2 167446.5
Mining 330.0 1.0 340.0 343.4 346.8 350.3 353.8
Transformation 1535.1 10.5 2071.2 2288.7 2529.0 2794.5 3088.5
al industry
Power & water 2130.7 6.0 2537.7 2690.0 2851.4 3022.4 3203.8
Construction & 13768.4 6.8 16772.5 17913.0 19131.1 20432.0 21821.4
building
Transportation 14313.9 7.0 17535.1 18762.6 20076.0 21481.3 22985.0
&
telecommunica
tion
Trade 14872.9 8.3 18892.1 20460.2 22158.4 23997.5 25989.3
Finance 11815.1 2.6 12760.8 13092.6 13433.0 13782.3 14140.6
&insurance
Services 19777.8 4.5 22569.8 23585.4 24646.7 25755.8 26914.9
Non - oil 81402.0 6.1 98201.8 104255.3 110721.6 117631.5 125017.3
activities
Total $b 182331.2 7.0 223585.8 239042.8 255618.5 273395.7 292463.8
189.2 202.2 216.3 231.3 247.4
It is clear that the plan aims to increase the gross domestic product and fixed prices to
(292.5) trillion dinars in 2022 compared to (182.3) trillion dinars in 2015 and an absolute
increase of (110.2) trillion dinars and a growth rate of 7%. The main target sectors are the
industry sector 10.5% and the agricultural sector 8.4%. These rates are conditional on the
availability of the necessary investments in both public and private sectors.
| www.investpromo.gov.iq
www.nici.gov.iq
Info @ investpromo.gov.iq
info@nici.gov.iq