Page 20 - investment-map-En-2021
P. 20

14
                    Iraq Investment Map2020-2021
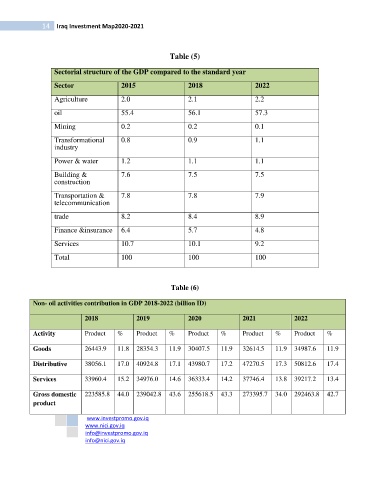


                                                         Table (5)

                   Sectorial structure of the GDP compared to the standard year

                   Sector                2015                  2018                  2022

                   Agriculture           2.0                   2.1                   2.2
                   oil                   55.4                  56.1                  57.3

                   Mining                0.2                   0.2                   0.1

                   Transformational      0.8                   0.9                   1.1
                   industry
                   Power & water         1.2                   1.1                   1.1

                   Building &            7.6                   7.5                   7.5
                   construction

                   Transportation &      7.8                   7.8                   7.9
                   telecommunication

                   trade                 8.2                   8.4                   8.9

                   Finance &insurance    6.4                   5.7                   4.8
                   Services              10.7                  10.1                  9.2

                   Total                 100                   100                   100


                                                          Table (6)


            Non- oil activities contribution in GDP 2018-2022 (billion ID)

                             2018             2019             2020              2021             2022

            Activity         Product    %     Product    %     Product    %      Product    %     Product    %

            Goods            26443.9    11.8  28354.3    11.9  30407.5    11.9   32614.5    11.9  34987.6    11.9

            Distributive     38056.1    17.0  40924.8    17.1  43980.7    17.2   47270.5    17.3  50812.6    17.4

            Services         33960.4    15.2  34976.0    14.6  36333.4    14.2   37746.4    13.8  39217.2    13.4

            Gross domestic  223585.8  44.0  239042.8  43.6  255618.5  43.3       273395.7  34.0  292463.8  42.7
            product


                                  www.investpromo.gov.iq
                               www.nici.gov.iq
                               info @ investpromo.gov.iq

                               info@nici.gov.iq
   15   16   17   18   19   20   21   22   23   24   25